economic development
Regional Benchmarks
To assess the relative strengths and weaknesses of the economy in CNY, the region can be benchmarked against data from other parts of the country. The most efficient vehicle for comparison is federally Census designated Metropolitan Statistical Areas (MSAs). An MSA is defined as a geographical region with a relatively high population density at its core and close economic ties throughout the area. There are currently 366 MSAs in the United States; the Syracuse MSA consist of Madison, Onondaga, and Oswego Counties.
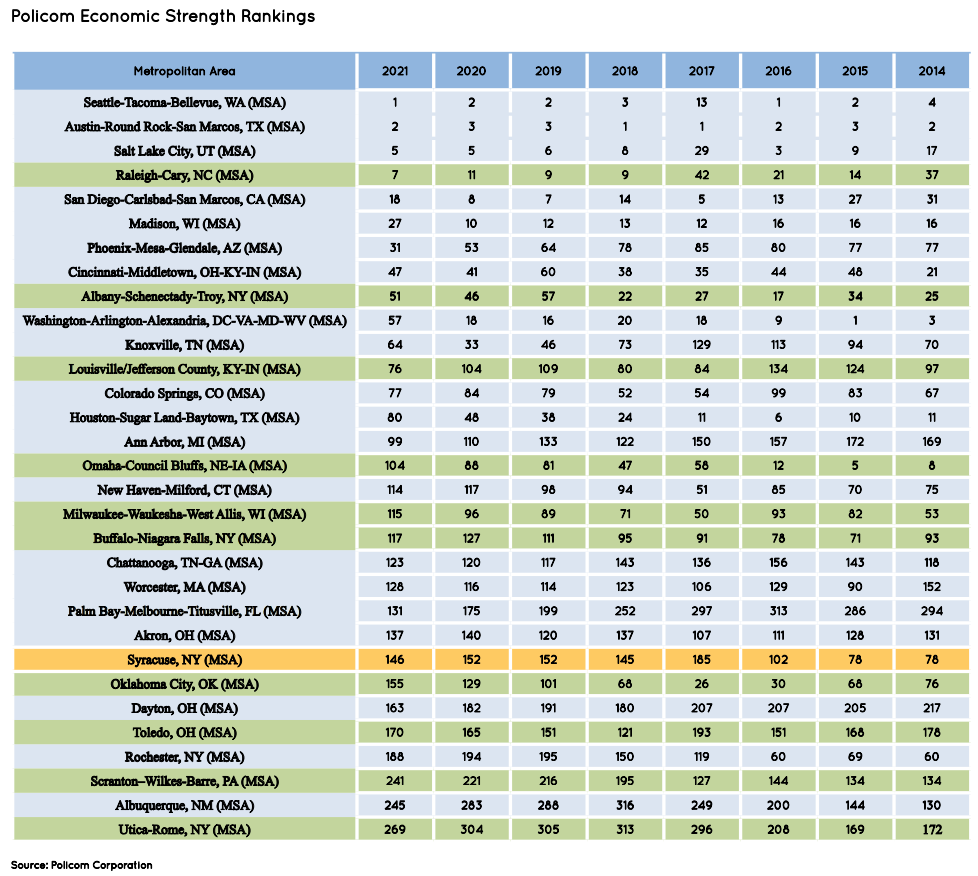
To evaluate the relative state of the region’s economy, two ranking services were found to be particularly informative: the Policom Corporation’s Economic Strength Rankings and the Milken Institute’s Best Performing Cities. The Policom approach emphasizes the condition of local economies. Weight in its rankings is given to areas that have demonstrated rapid and consistent growth for an extended period of time. Areas with volatile growth typically rank lower. Three groups of data are considered:
- Earnings, jobs, and wages for the whole area and on a per capita basis reflect overall growth in the size and quality of a local economy.
- The same data, but specifically for small businesses (proprietors), the construction industry, and the retail industry, are measured because it is highly reactive to changes in the flow of money into or out of an area.
- Welfare and Medicare income are tracked as negative indicators of local economic performance.
The most recent release of Policom’s rankings (2021) provides 10 years of rankings dating to 2012. The Syracuse MSA saw its highest ranking in 2014-2015 at 78 before reaching its low point of 185 in 2017. Since then, the Syracuse MSA has climbed back up the ranking to its current position at 146. Similar to Syracuse, other Upstate NY MSAs saw their highest peaks around 2015 and have since recovered from significant drops, with Albany and Buffalo ranking higher than the Syracuse MSA , 51 and 117 respectively.

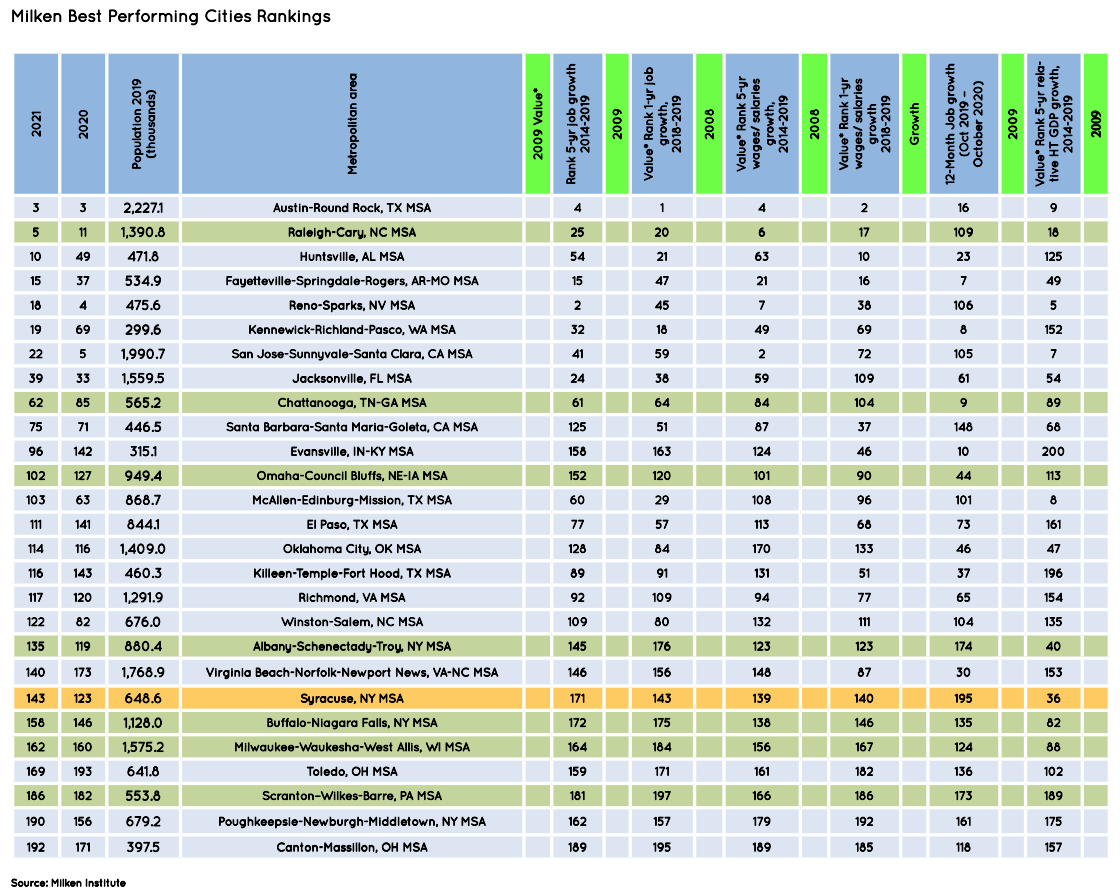
The Milken ranking system focuses on job and wage growth to pinpoint areas that are thriving. Additionally, the system incorporates a measurement of high technology GDP growth and high technology location quotients to weight for a metro area’s participation in the knowledge economy. The Syracuse MSA has seen its ranking drop over the last ten years falling to 143 from a high of 80 in 2010. The Syracuse MSA saw its highest ranking in high-tech GDP (36), high-tech concentration (49), the number of high-tech industries with a location quotient (LQ) above the U.S. average of 1.0 (37), and housing affordability (46).

